

文本是《网站建设(共29篇)》专题的第 15 篇。阅读本文前,建议先阅读前面的文章:
- 1.网站建设的10个流程,一起了解一个完整的建站步骤
- 2.如何优化网站SEO(关键技巧分享,让你的网站排名更靠前)
- 3.最新Seo网站关键词以及网站内容优化技巧
- 4.网站SEO最新优化方法,7个网站SEO的核心技巧
- 5.2023最新30条可有效执行的站内SEO优化建议,纯干货
- 6.抖音这么火,保姆级教程:抖音SEO如何做?
- 7.赖胖教你新手从购买云服务器到整个web应用部署过程
- 8.服务器搭建网站完整教程(宝塔面板+wordpress)
- 9.用腾讯云Lighthouse轻量应用服务器,5分钟搞定博客站点打造计划
- 10.一天完成,保姆级实战教程:从0到1搭建AI导航网站教程
- 11.网站受攻击?经验总结,宝塔面板安装完必须要做的一些事,可保服务器安全无忧
- 12.Linux系统管理如何挂载Mount光盘
- 13.让Linux系统更安全不再烦心 – 安全和权限问题
- 14.2023全网最详细:个人网站如何备案
主要内容:数据分析。
适用人群:Python初学者,数据分析师,或有志从事数据分析工作的人员。
准备软件:Anaconda(Spyder:代码编译)、Navicat Premium 12(数据库)。

从事IT项目管理这么多年,基本上已经遗弃编程技能,但从2019年开始接触Python,深深地迷上了这门语言,像硬件集成、数据分析,我都会用python来写。晓风想通过本文,让初学者们学会以下内容:
1、Pyecharts图表;
2、连接数据库;
3、大屏看板-监控中心。
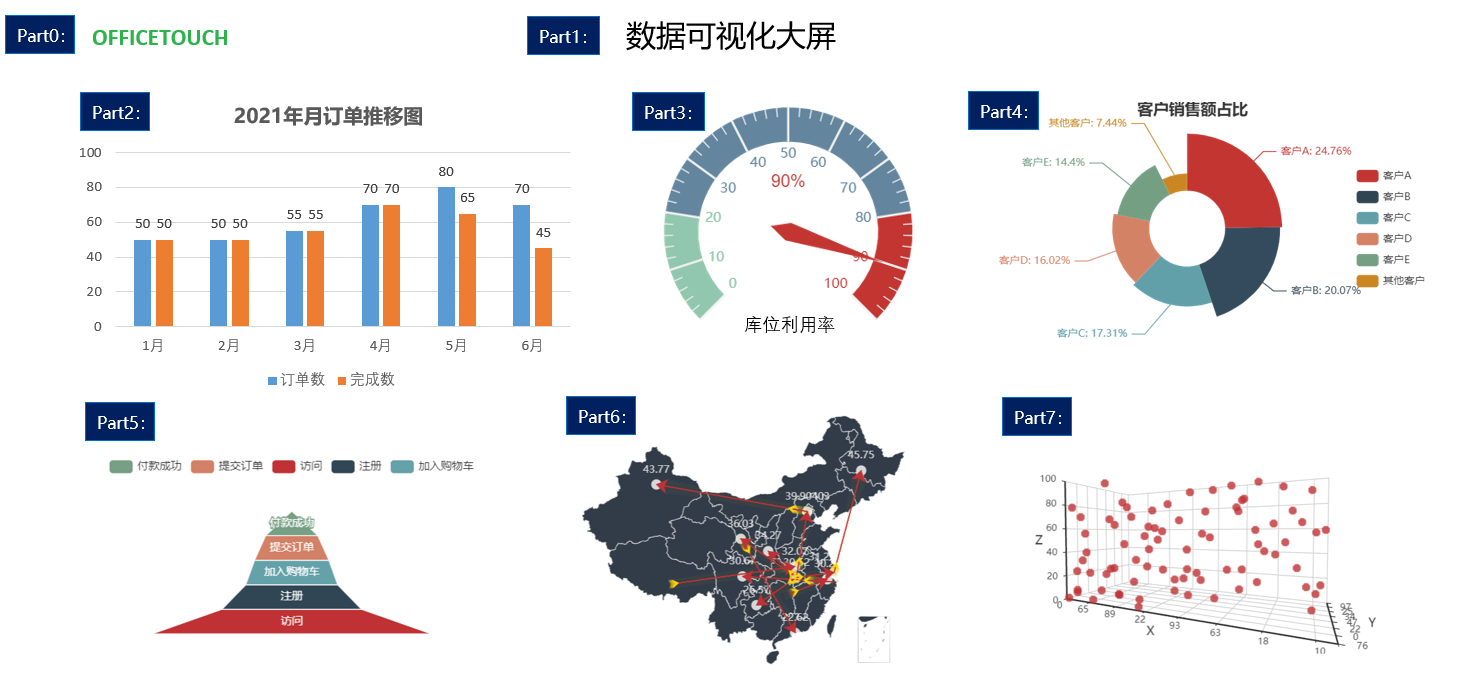
今天,我们讲:3、大屏看板如何布局
首先,我们自己先拟个大屏的草稿(如上图),把大屏分割成8个部分(Part0-7)。
大屏内容设计好后,接上文,我们把图表的函数都用代码写出来
from pyecharts import options as opts
from pyecharts.charts import Bar,Gauge,Pie,Page,Funnel,Geo,Scatter3D
import random


def bar(): #柱状图
    cate = ['1月', '2月', '3月', '4月', '5月', '6月']
    c = (
         Bar()
            .add_xaxis(cate)
            .add_yaxis("订单数", [random.randint(100, 200) for _ in cate])
            .add_yaxis("完成数", [random.randint(50, 100) for _ in cate])
            .set_series_opts(
                             label_opts=opts.LabelOpts(is_show=True,color="#2CB34A")

            )
            .set_global_opts(title_opts=opts.TitleOpts(title="2021年订单推移图",
                                                       title_textstyle_opts=opts.TextStyleOpts(color="#2CB34A"),
                                                       pos_left="5%"),
                             legend_opts=opts.LegendOpts(textstyle_opts=opts.TextStyleOpts(color="#2CB34A")),
                             xaxis_opts=opts.AxisOpts(axislabel_opts=opts.LabelOpts(color="#2CB34A")),
                             yaxis_opts=opts.AxisOpts(axislabel_opts=opts.LabelOpts(color="#2CB34A"))

            )
            .set_colors(["blue", "green"])
            #.render("bar_stack0.html")
    )
    return c


def tab0(name,color): #标题
    c = (Pie().
        set_global_opts(
        title_opts=opts.TitleOpts(title=name,pos_left='center',pos_top='center',
                                title_textstyle_opts=opts.TextStyleOpts(color=color,font_size=20))))
    return c


def tab1(name,color): #标题
    c = (Pie().
        set_global_opts(
        title_opts=opts.TitleOpts(title=name,pos_left='center',pos_top='center',
                                title_textstyle_opts=opts.TextStyleOpts(color=color,font_size=25))))
    return c


def gau():#仪表图
    c = (
        Gauge(init_opts=opts.InitOpts(width="400px", height="400px"))
            .add(series_name="库位利用率", data_pair=[["", 90]])
            .set_global_opts(
            legend_opts=opts.LegendOpts(is_show=False),
            tooltip_opts=opts.TooltipOpts(is_show=True, formatter="{a} <br/>{b} : {c}%"),

        )
            #.render("gauge.html")
    )
    return c


def radius():
    cate = ['客户A', '客户B', '客户C', '客户D', '客户E', '其他客户']
    data = [153, 124, 107, 99, 89, 46]
    c=Pie()
    c.add('', [list(z) for z in zip(cate, data)],
            radius=["30%", "75%"],
            rosetype="radius")
    c.set_global_opts(title_opts=opts.TitleOpts(title="客户销售额占比", padding=[1,250],title_textstyle_opts=opts.TextStyleOpts(color="#FFFFFF")),
                      legend_opts=opts.LegendOpts(textstyle_opts=opts.TextStyleOpts(color="#FFFFFF"),type_="scroll",orient="vertical",pos_right="5%",pos_top="middle")
                      )
    c.set_series_opts(label_opts=opts.LabelOpts(formatter="{b}: {d}%"))
    c.set_colors(['red',"orange", "yellow", "green", "Cyan", "purple"])

    return c


def funnel():
    cate = ['访问', '注册', '加入购物车', '提交订单', '付款成功']
    data = [30398, 15230, 10045, 8109, 5698]
    c = Funnel()
    c.add("用户数", [list(z) for z in zip(cate, data)],
               sort_='ascending',
               label_opts=opts.LabelOpts(position="inside"))
    c.set_global_opts(title_opts=opts.TitleOpts(title=""))


    return c


def geo():
    city_num = [('武汉',105),('成都',70),('北京',99),
            ('西安',80),('杭州',60),('贵阳',34),
            ('上海',65),('深圳',54),('乌鲁木齐',76),
            ('哈尔滨',47),('兰州',56),('信阳',85)]
    start_end = [('宁波','成都'),('武汉','北京'),('武汉','西安'),
             ('长沙','杭州'),('武汉','贵阳'),('武汉','上海'),
             ('甘肃','深圳'),('北京','乌鲁木齐'),('上海','哈尔滨'),
             ('武汉','兰州'),('西藏','信阳')]
    c = Geo()
    c.add_schema(maptype='china',
                itemstyle_opts=opts.ItemStyleOpts(color='#323c48', border_color='white'))
    # 4.添加数据
    c.add('', data_pair=city_num, color='white')
    c.add('', data_pair=start_end, type_="lines",label_opts=opts.LabelOpts(is_show=False),
         effect_opts=opts.EffectOpts(symbol="arrow",
                                     color='gold',
                                     symbol_size=7))
    c.set_global_opts(
        title_opts = opts.TitleOpts(title=""))

    return c


def scatter3D():
    data = [(random.randint(0, 100), random.randint(0, 100), random.randint(0, 100)) for _ in range(80)]
    c = (Scatter3D()
            .add("", data)
            .set_global_opts(
              title_opts=opts.TitleOpts(""),
            )
        )
接下来,我们引用Page函数,将所有图表堆积在一个页面中,代码如下
from pyecharts.charts import Page
page = Page()
page.add(
tab0("OFFICETOUCH","#2CB34A"),
bar(),
tab1("数据可视化大屏","#2CB34A"),
gau(),
radius(),
funnel(),
geo(),
scatter3D()
)
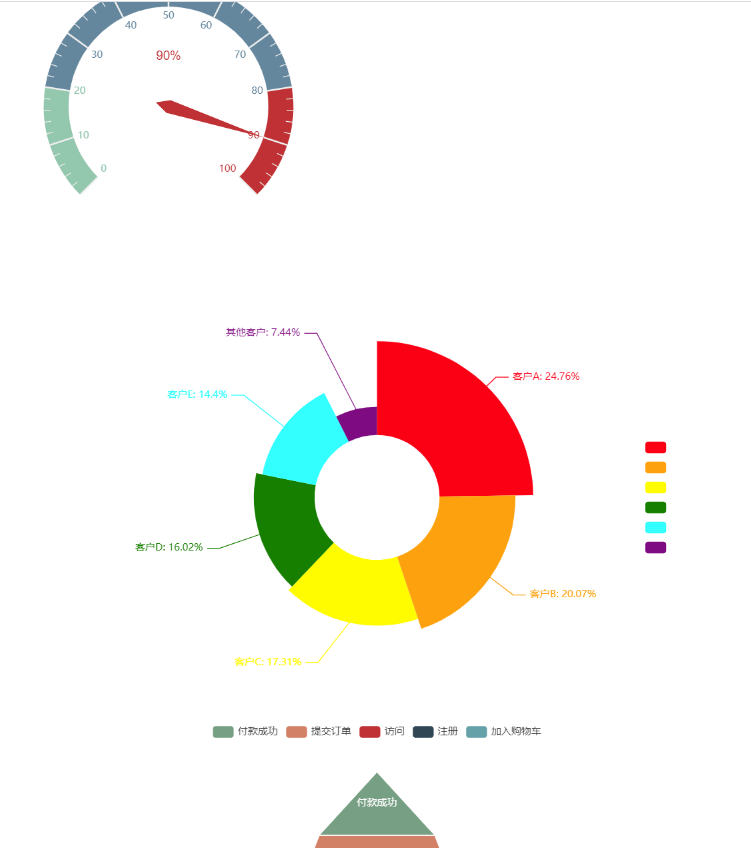
page.render("datacenter.html")我们运行下上述两段代码,发现布局是按照从上到下一个个呈现的,到此我们完成了一半的编码
为了将图表按照我们的草稿布局,我们再引用HTML(from bs4 import BeautifulSoup)
from bs4 import BeautifulSoup
with open("datacenter.html", "r+", encoding='utf-8') as html:
    html_bf = BeautifulSoup(html, 'lxml')
    divs = html_bf.select('.chart-container')
    divs[0]["style"] = "width:10%;height:10%;position:absolute;top:0;left:2%;"
    divs[1]["style"] = "width:40%;height:40%;position:absolute;top:12%;left:0;"
    divs[2]["style"] = "width:35%;height:10%;position:absolute;top:2%;left:30%;"
    divs[3]["style"] = "width:40%;height:40%;position:absolute;top:10%;left:28%;"
    divs[4]["style"] = "width:40%;height:35%;position:absolute;top:12%;left:55%;"
    divs[5]["style"] = "width:30%;height:35%;position:absolute;top:60%;left:2%;"
    divs[6]["style"] = "width:60%;height:50%;position:absolute;top:45%;left:15%;"
    divs[7]["style"] = "width:35%;height:40%;position:absolute;top:50%;left:60%;"
    body = html_bf.find("body")
    body["style"] = "background-image: "  # 背景颜色
    html_new = str(html_bf)
    html.seek(0, 0)
    html.truncate()
    html.write(html_new)
    html.close()
代码中的divs[0][“style”] = “width:10%;height:10%;position:absolute;top:0;left:2%;” 即是我们对Part0的宽度、高度、位置、上边距、左边距的定义,这里我们用百分比以达到屏幕自适应的效果。
最后,我们还可以设置一张背景图,代码合起来如下
from pyecharts import options as opts
from pyecharts.charts import Bar,Gauge,Pie,Page,Funnel,Geo,Scatter3D
import random


def bar(): #柱状图
    cate = ['1月', '2月', '3月', '4月', '5月', '6月']
    c = (
         Bar()
            .add_xaxis(cate)
            .add_yaxis("订单数", [random.randint(100, 200) for _ in cate])
            .add_yaxis("完成数", [random.randint(50, 100) for _ in cate])
            .set_series_opts(
                             label_opts=opts.LabelOpts(is_show=True,color="#2CB34A")

            )
            .set_global_opts(title_opts=opts.TitleOpts(title="2021年订单推移图",
                                                       title_textstyle_opts=opts.TextStyleOpts(color="#2CB34A"),
                                                       pos_left="5%"),
                             legend_opts=opts.LegendOpts(textstyle_opts=opts.TextStyleOpts(color="#2CB34A")),
                             xaxis_opts=opts.AxisOpts(axislabel_opts=opts.LabelOpts(color="#2CB34A")),
                             yaxis_opts=opts.AxisOpts(axislabel_opts=opts.LabelOpts(color="#2CB34A"))

            )
            .set_colors(["blue", "green"])
            #.render("bar_stack0.html")
    )
    return c


def tab0(name,color): #标题
    c = (Pie().
        set_global_opts(
        title_opts=opts.TitleOpts(title=name,pos_left='center',pos_top='center',
                                title_textstyle_opts=opts.TextStyleOpts(color=color,font_size=20))))
    return c


def tab1(name,color): #标题
    c = (Pie().
        set_global_opts(
        title_opts=opts.TitleOpts(title=name,pos_left='center',pos_top='center',
                                title_textstyle_opts=opts.TextStyleOpts(color=color,font_size=25))))
    return c


def gau():#仪表图
    c = (
        Gauge(init_opts=opts.InitOpts(width="400px", height="400px"))
            .add(series_name="库位利用率", data_pair=[["", 90]])
            .set_global_opts(
            legend_opts=opts.LegendOpts(is_show=False),
            tooltip_opts=opts.TooltipOpts(is_show=True, formatter="{a} <br/>{b} : {c}%"),

        )
            #.render("gauge.html")
    )
    return c


def radius():
    cate = ['客户A', '客户B', '客户C', '客户D', '客户E', '其他客户']
    data = [153, 124, 107, 99, 89, 46]
    c=Pie()
    c.add('', [list(z) for z in zip(cate, data)],
            radius=["30%", "75%"],
            rosetype="radius")
    c.set_global_opts(title_opts=opts.TitleOpts(title="客户销售额占比", padding=[1,250],title_textstyle_opts=opts.TextStyleOpts(color="#FFFFFF")),
                      legend_opts=opts.LegendOpts(textstyle_opts=opts.TextStyleOpts(color="#FFFFFF"),type_="scroll",orient="vertical",pos_right="5%",pos_top="middle")
                      )
    c.set_series_opts(label_opts=opts.LabelOpts(formatter="{b}: {d}%"))
    c.set_colors(['red',"orange", "yellow", "green", "Cyan", "purple"])

    return c


def funnel():
    cate = ['访问', '注册', '加入购物车', '提交订单', '付款成功']
    data = [30398, 15230, 10045, 8109, 5698]
    c = Funnel()
    c.add("用户数", [list(z) for z in zip(cate, data)],
               sort_='ascending',
               label_opts=opts.LabelOpts(position="inside"))
    c.set_global_opts(title_opts=opts.TitleOpts(title=""))


    return c


def geo():
    city_num = [('武汉',105),('成都',70),('北京',99),
            ('西安',80),('杭州',60),('贵阳',34),
            ('上海',65),('深圳',54),('乌鲁木齐',76),
            ('哈尔滨',47),('兰州',56),('信阳',85)]
    start_end = [('宁波','成都'),('武汉','北京'),('武汉','西安'),
             ('长沙','杭州'),('武汉','贵阳'),('武汉','上海'),
             ('甘肃','深圳'),('北京','乌鲁木齐'),('上海','哈尔滨'),
             ('武汉','兰州'),('西藏','信阳')]
    c = Geo()
    c.add_schema(maptype='china',
                itemstyle_opts=opts.ItemStyleOpts(color='#323c48', border_color='white'))
    # 4.添加数据
    c.add('', data_pair=city_num, color='white')
    c.add('', data_pair=start_end, type_="lines",label_opts=opts.LabelOpts(is_show=False),
         effect_opts=opts.EffectOpts(symbol="arrow",
                                     color='gold',
                                     symbol_size=7))
    c.set_global_opts(
        title_opts = opts.TitleOpts(title=""))

    return c


def scatter3D():
    data = [(random.randint(0, 100), random.randint(0, 100), random.randint(0, 100)) for _ in range(80)]
    c = (Scatter3D()
            .add("", data)
            .set_global_opts(
              title_opts=opts.TitleOpts(""),
            )
        )
    return c


page = Page()
page.add(
         tab0("OFFICETOUCH","#2CB34A"),
         bar(),
         tab1("数据可视化大屏","#2CB34A"),
         gau(),
         radius(),
         funnel(),
         geo(),
         scatter3D()
         )
page.render("datacenter.html")
#os.system("scatter.html")


from bs4 import BeautifulSoup
with open("datacenter.html", "r+", encoding='utf-8') as html:
    html_bf = BeautifulSoup(html, 'lxml')
    divs = html_bf.select('.chart-container')
    divs[0]["style"] = "width:10%;height:10%;position:absolute;top:0;left:2%;"
    divs[1]["style"] = "width:40%;height:40%;position:absolute;top:12%;left:0;"
    divs[2]["style"] = "width:35%;height:10%;position:absolute;top:2%;left:30%;"
    divs[3]["style"] = "width:40%;height:40%;position:absolute;top:10%;left:28%;"
    divs[4]["style"] = "width:40%;height:35%;position:absolute;top:12%;left:55%;"
    divs[5]["style"] = "width:30%;height:35%;position:absolute;top:60%;left:2%;"
    divs[6]["style"] = "width:60%;height:50%;position:absolute;top:45%;left:15%;"
    divs[7]["style"] = "width:35%;height:40%;position:absolute;top:50%;left:60%;"
    body = html_bf.find("body")
    body["style"] = "background-image: url(bgd.jpg)"  # 背景颜色
    html_new = str(html_bf)
    html.seek(0, 0)
    html.truncate()
    html.write(html_new)
效果图如下:
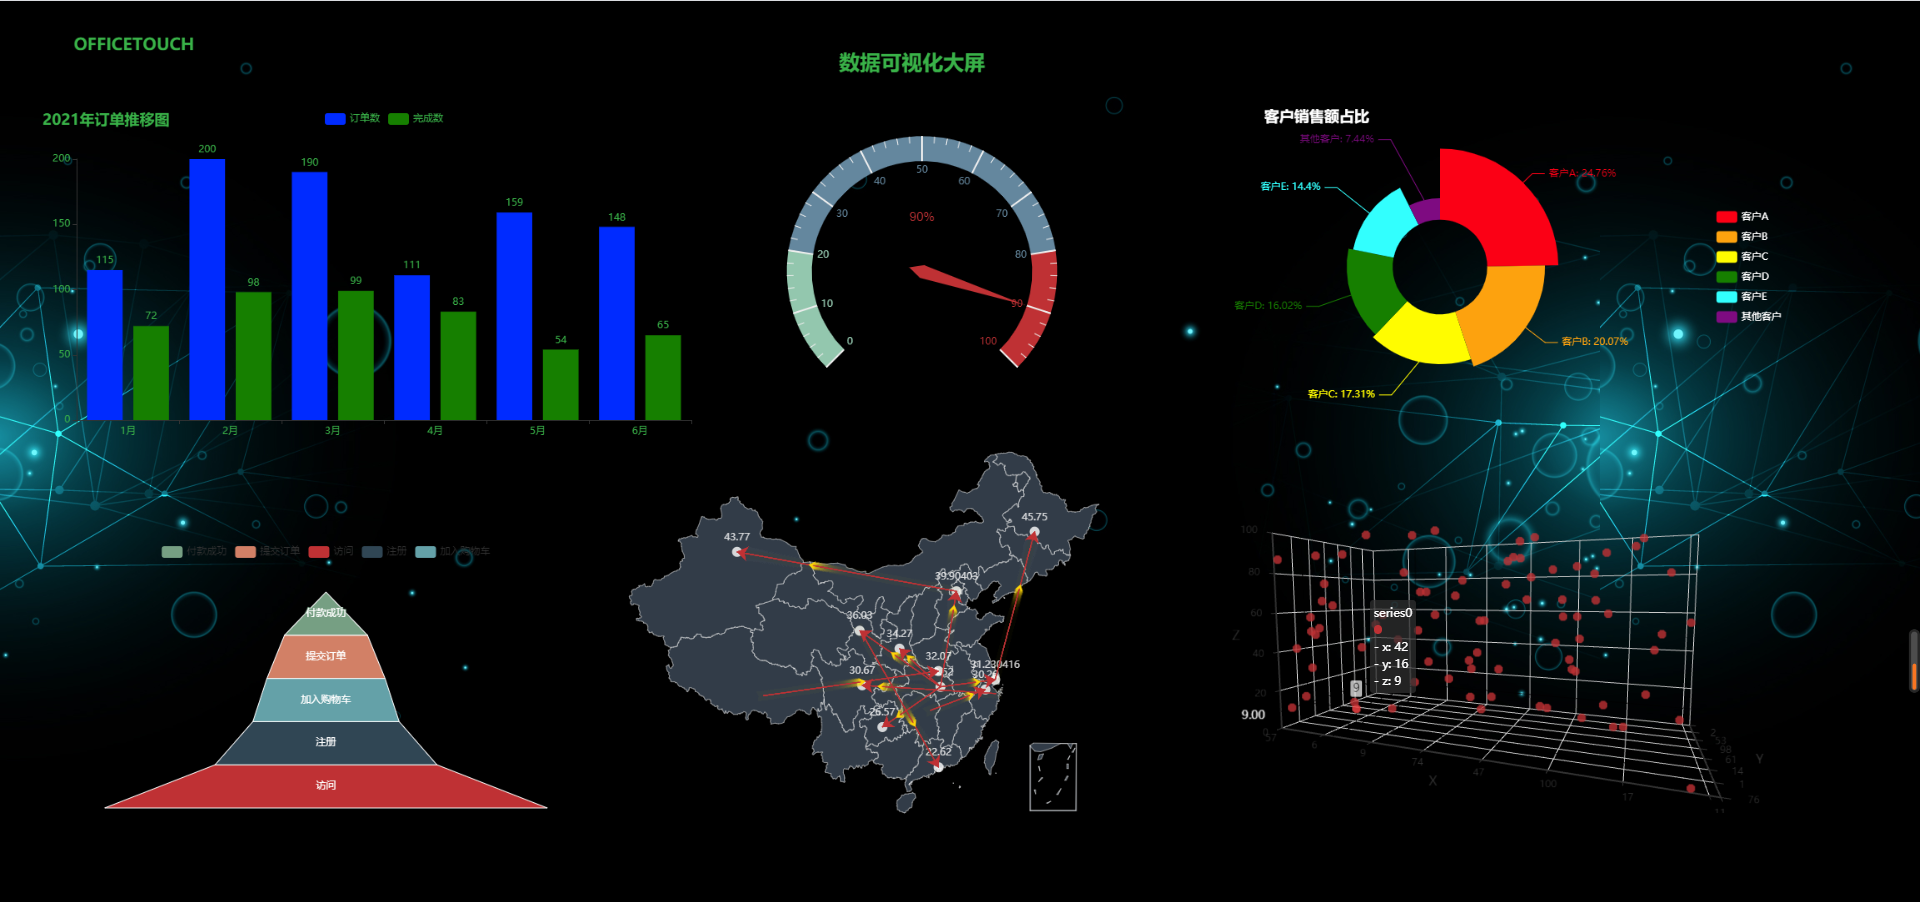
学习到了这里,你是否能独立完成数据可视化的工作了啊?晓风终于不辱使命,向大家完整地介绍了如何使用Python绘制数据可视化大屏。晓风还会继续努力,为大家带来更多有趣、实用、简单的Python功能,愿我们一起成长!
继续学习

Python大屏看板安全设置
您已阅读完《网站建设(共29篇)》专题的第 15 篇。请继续阅读该专题下面的文章:
- 16.云服务器搭建Python大屏看板最全教程之数据库连接
- 17.玩转服务器之网站篇:新手使用 WordPress 搭建博客和静态网站部署
- 18.绝对干货|新网站每个wordpress站长都推荐完成的60个任务清单
- 19.搭建跨境独立站,选择Shopify还是WooCommerce?一篇文章讲清楚
- 20.做国外跨境网站如何轻松搞定海外红人合作!
- 21.WordPress网站想做SEO优化,这步千万不能忘,否则会让收录变很差
- 22.如何配置cdn且如何防止被刷流量教程
- 23.北京SEO-提高网站排名的终极指南:页面结构与链接URL优化法则
- 24.北京SEO-最佳博客网站SEO优化排名攻略及细节解析
- 25.中文网站使用Rank Math SEO插件的7个优化技巧
- 26.2023年Rank Math vs Yoast SEO:哪个更适合SEO?
- 27.为什么 WordPress 恶意软件扫描程序毫无价值
- 28.2023 年最新亚洲搜索引擎趋势,Bing的份额强势增长
- 29.xmlrpc.php 经常被扫描攻击,导致服务器负载过高
